
Supporting Sustainable Development Goals
At Aswan University, we are dedicated to advancing the United Nations Sustainable Development Goals (SDGs). Through our commitment to sustainable practices and carbon reduction, we contribute to global efforts for a greener future.
At Aswan University, we adhere to the internationally recognized Greenhouse Gas Protocol standards, guiding our comprehensive approach to measuring, managing, and reducing our carbon footprint. By aligning with these rigorous standards, we ensure transparency, accuracy, and accountability in our sustainability initiatives.
Overview of GHG Protocol scopes and emissions across the value chain
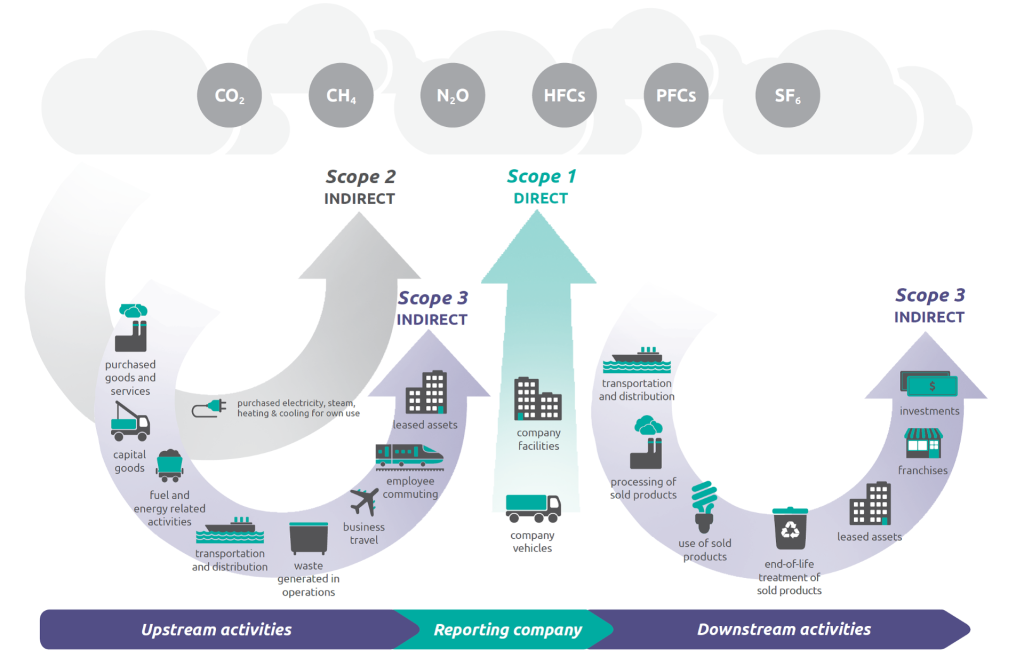
Source: WRI/WBCSD Corporate Value Chain (Scope 3) Accounting and Reporting Standard (PDF), page 5.
1. Scope 1 Emissions:
Scope 1 emissions encompass direct greenhouse gas emissions produced from sources owned or controlled by our university. These emissions arise from activities like on-campus fuel combustion, heating, and vehicle fleets. By tracking and reducing our Scope 1 emissions, we aim to minimize our direct environmental impact and contribute to a sustainable campus.
- Annual Usage
| Source | Diesel (vehicles) | Gasoline (vehicles) | Natural Gas (boilres) | LPG | Propan | |
| year | unit | liters | liters | cubic meters | liters | liters |
| 2023/2024 | Annual usage | 170128 | 55208 | 0 | 15840 | 10560 |
| emission factor (kg Co2e/unit) | 2.68 | 2.31 | 2.03 | 1.51 | 1.51 | |
| total emissions (kgCO2e) | 455943.04 | 127530.48 | 0 | 23918.4 | 15945.6 | |
| 2022/2023 | Annual usage | 280790 | 39968 | 28.8 | ||
| emission factor (kg Co2e/unit) | ||||||
| total emissions (kgCO2e) | ||||||
| 2021/2022 | Annual usage | 302500 | 39000 | 10600 | 2650 | |
| emission factor (kg Co2e/unit) | ||||||
| total emissions (kgCO2e) | 20.6535 | |||||
| 2020/2021 | Annual usage | |||||
| emission factor (kg Co2e/unit) | ||||||
| total emissions (kgCO2e) | ||||||
| 2019/2020 | Annual usage | |||||
| emission factor (kg Co2e/unit) | ||||||
| total emissions (kgCO2e) | ||||||
| 2018/2019 | Annual usage | |||||
| emission factor (kg Co2e/unit) | ||||||
| total emissions (kgCO2e) | ||||||
| 2017/2018 | Annual usage | 184380 | 135150 | |||
| emission factor (kg Co2e/unit) | ||||||
| total emissions (kgCO2e) | ||||||
2. Scope 2 Emissions:
Scope 2 emissions relate to indirect greenhouse gas emissions associated with our purchased energy consumption. This includes the electricity we use to power our buildings and facilities. We focus on reducing Scope 2 emissions by increasing energy efficiency, adopting renewable energy sources, and optimizing our electricity consumption patterns.
- Purchased Electricity
| Year | Annual usage | unit | emission factor (kg Co2e/unit) | Total emissions (kg CO2e) | total emissions (tCO2e) |
| 2023/2024 | 7183472 | kw/h | 0.672 | 4827293.184 | 4827.293184 |
| 2022/2023 | 7072944 | 9781900 | 9781.9 | ||
| 2021/2022 | 8398495.569 | 11615100 | 11615.1 | ||
| 2020/2021 | _ | ||||
| 2019/2020 | _ | ||||
| 2018/2019 | _ | ||||
| 2017/2018 | 4860323.321 |
3. Scope 3 Emissions:
Scope 3 emissions encompass broader indirect emissions beyond our direct operations. These emissions arise from sources such as commuting, waste disposal, and supply chain activities. By addressing Scope 3 emissions, we take a comprehensive approach to sustainability, working with our community and partners to collectively reduce our carbon footprint.
| Category | Staff Commuting | Student Commuting | Business Travel (Car) | Business Travel (Air) | Purchased Goods | Waste Disposal | Water Consumption | Wastewater Treatment | |
| year | Unit description | km/year | km/year | km/year | km/year | kg/year | kg/year | m³/year | m³/year |
| 2023/2024 | Annual usage | 0 | 91502404 | 0 | 0 | 0 | 61893 | 685114.0405 | 0 |
| emission factor (kg Co2e/unit) | 0.12 | 0.07 | 0.21 | 0.15 | 0.3 | 0.57 | 0.344 | 0.708 | |
| total emissions (kgCO2e) | 0 | 6405168.28 | 0 | 0 | 0 | 35279.01 | 235679.2299 | 0 | |
| 2022/2023 | Annual usage | Not Available | Not Available | Not Available | Not Available | Not Available | Not Available | 366000 | Not Available |
| emission factor (kg Co2e/unit) | Not Available | Not Available | Not Available | Not Available | Not Available | Not Available | Not Available | Not Available | |
| total emissions (kgCO2e) | Not Available | Not Available | Not Available | Not Available | Not Available | Not Available | Not Available | Not Available | |
| 2021/2022 | Annual usage | Not Available | Not Available | Not Available | Not Available | Not Available | Not Available | 986258.57 | Not Available |
| emission factor (kg Co2e/unit) | Not Available | Not Available | Not Available | Not Available | Not Available | Not Available | Not Available | Not Available | |
| total emissions (kgCO2e) | Not Available | Not Available | Not Available | Not Available | Not Available | Not Available | Not Available | Not Available | |
| 2020/2021 | Annual usage | Not Available | Not Available | Not Available | Not Available | Not Available | Not Available | Not Available | Not Available |
| emission factor (kg Co2e/unit) | Not Available | Not Available | Not Available | Not Available | Not Available | Not Available | Not Available | Not Available | |
| total emissions (kgCO2e) | Not Available | Not Available | Not Available | Not Available | Not Available | Not Available | Not Available | Not Available | |
| 2019/2020 | Annual usage | Not Available | Not Available | Not Available | Not Available | Not Available | Not Available | Not Available | Not Available |
| emission factor (kg Co2e/unit) | Not Available | Not Available | Not Available | Not Available | Not Available | Not Available | Not Available | Not Available | |
| total emissions (kgCO2e) | Not Available | Not Available | Not Available | Not Available | Not Available | Not Available | Not Available | Not Available | |
| 2018/2019 | Annual usage | Not Available | Not Available | Not Available | Not Available | Not Available | Not Available | Not Available | Not Available |
| emission factor (kg Co2e/unit) | Not Available | Not Available | Not Available | Not Available | Not Available | Not Available | Not Available | Not Available | |
| total emissions (kgCO2e) | Not Available | Not Available | Not Available | Not Available | Not Available | Not Available | Not Available | Not Available | |
| 2017/2018 | Annual usage | Not Available | Not Available | Not Available | Not Available | Not Available | Not Available | 337385.35 | Not Available |
| emission factor (kg Co2e/unit) | Not Available | Not Available | Not Available | Not Available | Not Available | Not Available | Not Available | Not Available | |
| total emissions (kgCO2e) | Not Available | Not Available | Not Available | Not Available | Not Available | Not Available | Not Available | Not Available | |
| Summary | 2023/2024 |
| Carbon Footprint | |
| scope-1 | 623.33752 |
| scope -2 | 4827.293184 |
| scope -3 | 6676.12652 |
| Total Carbon Footprint:tCO2e | |
| 12126.75722 | |
Renewable Energy:
- Total Renewable Energy Generated: 17934 kw\h (2023\2024)
These figures represent our energy consumption over the specified years. We remain dedicated to continuously improving our energy efficiency and striving for further reductions in the years to come.
Total Carbon Footprint: 12126.75722 tCO2e
Note:
- The data provided is based on available information for the specified years.
- Carbon emissions are calculated based on standard conversion factors.
- Please note that this report represents a snapshot of energy consumption and carbon emissions for the given years and may be updated as more data becomes available.
Join Our Sustainability Movement
Be a part of Aswan University’s sustainability initiatives. Together, we can drive positive change and create a more sustainable future for all.
University Footprint